There's a certain type of person who finds comfort in cells, formulas, and automatically generated charts. If you're the kind of person who color-codes everything and feels a deep satisfaction watching numbers add up, a Google Sheets tracker might be your perfect 75 Soft companion.
Spreadsheets offer something no other tracking method can match: complete control over your data. You decide what to track, how to visualize it, and what formulas calculate your progress. Plus, you can access it from any device with Google Sheets—which is just about everything with a screen.
Why Google Sheets for 75 Soft
Before diving into the specifics, let's talk about why spreadsheets make excellent habit trackers:
The Data Advantage
- Custom formulas: Calculate streaks, averages, and trends automatically
- Automatic charts: See your progress visualized in real-time
- Conditional formatting: Cells change color based on completion status
- Complete flexibility: Track anything you want, formatted exactly how you want
Practical Benefits
- Free forever: No subscription, no premium features locked away
- Cross-device sync: Access from phone, tablet, or computer
- Offline access: Available even without internet (with the app)
- Easy sharing: Show your progress to accountability partners
- Data export: Your data is yours—export anytime in multiple formats
Spreadsheets are the ultimate "build your own adventure" tracking tool. No app will ever be as customizable as a well-designed Google Sheet.
Spreadsheet Overview and Features
A comprehensive 75 Soft Google Sheets tracker typically includes multiple tabs, each serving a specific purpose:
Essential Tabs
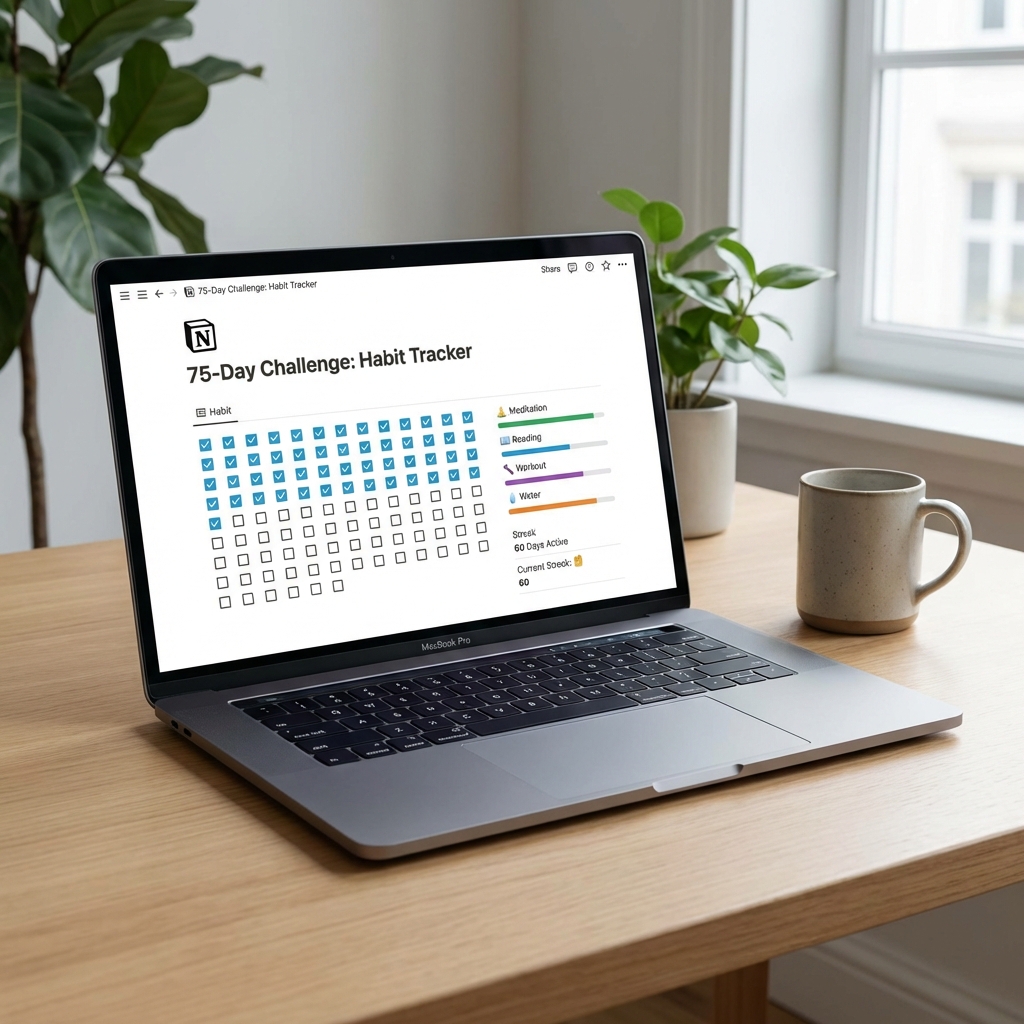
- Dashboard: Your homepage showing overall progress, current streak, and key stats
- Daily Tracking: 75 rows for each day, columns for each habit
- Measurements: Weekly body measurements and fitness markers
- Charts: Automatic visualizations of your data
Optional Tabs
- Workout Log: Detailed exercise tracking with duration, type, intensity
- Reading Log: Books read, pages per day, notes
- Meal Log: What you ate, rough calorie estimates if tracking
- Journal: Daily reflections in a text-heavy format
- Reference: Rules, motivation quotes, your "why"
Start Simple, Add Later
Don't build every tab on day one. Start with the Dashboard and Daily Tracking. Add other tabs only if you find yourself wanting more detail. Complexity is the enemy of consistency.
Daily Tracking Tab
The Daily Tracking tab is where you'll spend most of your time. Here's how to structure it for maximum usefulness:
Essential Columns
| Column | Type | Notes |
|---|---|---|
| Day # | Number (1-75) | Pre-filled |
| Date | Date | Calculated from start date |
| Exercise | Checkbox or ✓/✗ | 45 min completed |
| Diet | Checkbox or ✓/✗ | Ate well today |
| Reading | Checkbox or ✓/✗ | 10 pages completed |
| Water | Checkbox or ✓/✗ | 3L completed |
| All Complete | Formula | Auto-calculates if all 4 done |
Optional Tracking Columns
- Workout Type: Dropdown (Cardio, Strength, Yoga, Walk, etc.)
- Workout Duration: Number in minutes (to track extra effort)
- Book Title: Text field for current reading
- Pages Read: Number (if tracking beyond the minimum 10)
- Water Amount: Number in liters (if logging exact amounts)
- Recovery Day: Checkbox for the weekly active recovery
- Mood: Dropdown (Great, Good, Okay, Tough)
- Notes: Text for daily observations
Conditional Formatting Magic
Use conditional formatting to make your tracker visually intuitive:
- Green cells: When habit is complete (TRUE or ✓)
- Red cells: When habit is incomplete (FALSE or ✗)
- Yellow row: For today's date
- Gray rows: For future dates not yet reached
Measurements Tab
While daily habits are the core of 75 Soft, tracking physical and mental changes over time provides valuable context. The Measurements tab captures this data.
Weekly Physical Measurements
- Date: Measurement date (same day each week)
- Weight: Optional—skip if it triggers unhealthy behaviors
- Waist: Measured at navel
- Hips: Measured at widest point
- Chest: Measured at fullest point
- Arms: Measured at bicep
- Thighs: Measured at widest point
Fitness Markers
- Push-ups: Max in one set
- Plank hold: Time in seconds
- Running pace: Minutes per mile/km
- Steps average: Daily step count
Wellbeing Metrics
- Sleep hours: Average for the week
- Sleep quality: Rating 1-10
- Energy level: Rating 1-10
- Stress level: Rating 1-10
- Overall mood: Rating 1-10
Measurement Timing
Take measurements at the same time on the same day each week—ideally first thing in the morning after using the bathroom and before eating. Consistency in timing matters more than the specific day you choose.
Habit Score Formula
One of the most satisfying features of a spreadsheet tracker is creating a "Habit Score"—a gamified metric that gives you a single number representing your overall performance.
Basic Habit Score
The simplest approach: calculate what percentage of habits you completed.
= (Exercise + Diet + Reading + Water) / 4 × 100
Example: 3 out of 4 habits = 75%
Weighted Habit Score
If certain habits are harder for you, give them more weight:
= (Exercise×30 + Diet×30 + Reading×20 + Water×20) / 100
Customize weights based on your personal challenge areas
Streak Bonus
Reward consistency by adding streak multipliers:
- 7+ day streak: +5% bonus
- 14+ day streak: +10% bonus
- 30+ day streak: +15% bonus
- Complete all 75: +25% final bonus
Overall Challenge Score
Calculate a running total across all days:
= AVERAGE(All Daily Scores)
Perfect score = 100
Above 90 = Excellent | 80-90 = Great | 70-80 = Good
The habit score turns your challenge into a game. It's not about perfection—it's about seeing your number climb and competing with yourself.
Automatic Charts and Visualizations
Numbers are great, but charts make your progress visceral. Google Sheets can automatically generate these visualizations:
Essential Charts
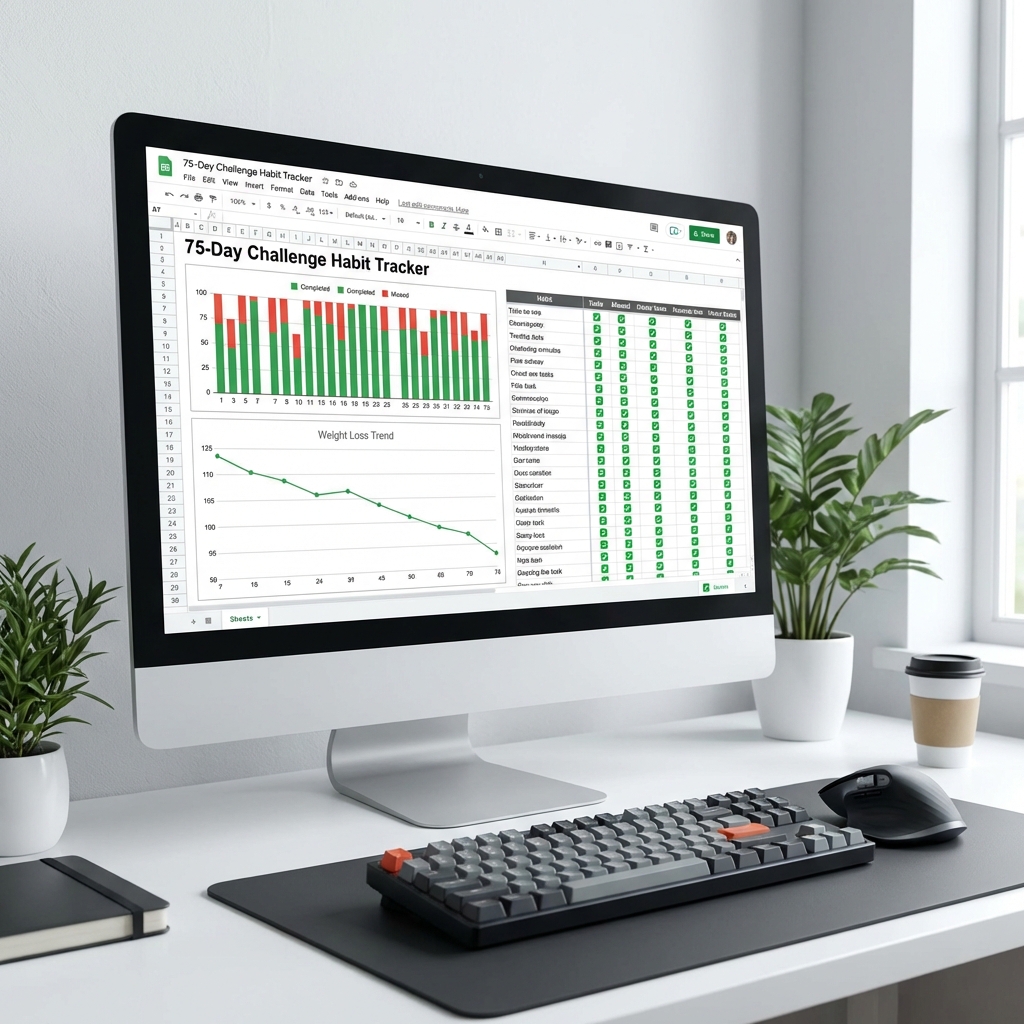
- Daily Completion Chart: Line graph showing daily scores over time
- Habit Breakdown Pie: Which habits you complete most/least often
- Weekly Progress Bars: Compare week-over-week performance
- Streak Tracker: Visual representation of your longest streaks
Measurement Charts
- Weight Trend Line: If tracking weight, show the trend over time
- Body Measurements: Multi-line chart tracking waist, hips, etc.
- Fitness Progress: Push-ups, plank time improvements
- Wellbeing Trends: Energy, sleep, mood over time
Creating Charts in Google Sheets
- Select the data range you want to visualize
- Go to Insert → Chart
- Choose chart type (line, bar, pie, etc.)
- Customize in the Chart Editor panel
- Move to Dashboard tab or Charts tab
Chart Tip
Create a dedicated "Charts" or "Dashboard" tab that pulls data from your tracking tabs. This keeps your main tracking area clean while giving you a visual overview whenever you want it.
How to Copy and Customize
Ready to get started? Here's how to find or create your 75 Soft Google Sheets tracker:
Finding Templates
- Google Search: "75 Soft Google Sheets template" will find shareable templates
- Reddit: r/75soft and r/googlesheets often share free templates
- Etsy/Gumroad: Paid templates ($3-10) often have more polish
- YouTube: Tutorial videos often link to the sheets they demonstrate
Making a Copy
- Open the template link
- Go to File → Make a Copy
- Rename to something like "My 75 Soft Tracker"
- The copy appears in your Google Drive
Customization Steps
- Set your start date: Update the challenge start date cell
- Review columns: Delete tracking columns you won't use
- Add personal columns: Insert any additional metrics you want
- Adjust formulas: Modify scoring formulas if desired
- Check conditional formatting: Make sure colors display correctly
- Test the charts: Enter sample data to verify charts work
Building From Scratch
If you prefer to build your own, here's the minimal approach:
- Create a new Google Sheet
- Row 1: Headers (Day, Date, Exercise, Diet, Reading, Water, Complete)
- Rows 2-76: Days 1-75 with formulas
- Use checkboxes (Insert → Checkbox) for habits
- Add a "Complete" formula: =AND(C2,D2,E2,F2)
- Apply conditional formatting for visual feedback
Mobile Access Tips
You'll likely update your tracker from your phone most days. Here's how to make that experience smooth:
- Download Google Sheets app: Available free for iOS and Android
- Star your tracker: Makes it appear at the top of your files
- Enable offline access: Settings → Offline → Make available offline
- Create a home screen shortcut: Open the sheet, tap ⋮, "Add to Home Screen"